This is an old revision of the document!
Maps
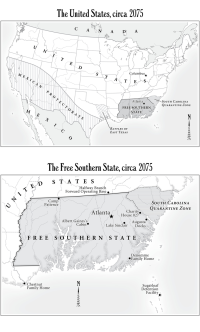
This first map is from American War by Omar El Akkad. It is a science-fiction/dystopian future novel about the second civil war in America.
 [Alt text]Two maps. he top map depicts The United States, circa 2075. The bottom map depicts a closer view of the Free Southern State, circa 2075. See the link below the image for an extended description.
[Long Description] The top map depicts The United States, circa 2075. The map shows the South Carolina Quarantine Zone (in modern day Florida) directly to the east of the larger Free Southern State (where Atlanta is). West of this is the Battles of East Texas area. The Mexican Protectorate lines the south western area of the map (including modern day California). The border between Canada and the U.S. remains pretty much the same as modern day.
The bottom map depicts a closer view of the Free Southern State, circa 2075, taking up the south east corner of modern day U.S. The map depicts the Chestnut family Home directly to the east coast of the state. Within the state, the capital is Atlanta in the central northeast, Camp Patience lines the border in the north west of the state. The Halfway Branch Forward Operating Base lines the northeast border. Slightly southwest of Atlanta is the Albert Gaines' Cabin; directly southwest is Lake Sinclair. East of this is August Docks, and north of this is Charity House 027. In the northeast, the South Carolina Quarantine Zone lies, and on an island to the south of the state is the Sugarloaf Detention Facility.
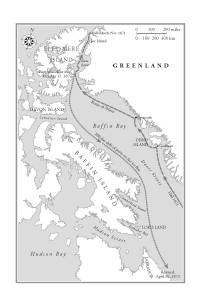
This next map is from Minds of Winter by Ed O'Loughlin, a historical fiction novel about the polar exploration of Canada. A very detailed description is given because the exploration of this area is key to the story, so the reader may want to refer to this map as they read through the book.
 [Alt text] Map showing West coast of Greenland, Ellesmere Island, Devon Island, and Baffin Island. Two routes are shown. One is labelled "Hall 1871" and "Route of Polaris" and head north along the coast of Greenland. The second route is labeled "200-day drift of party on the ice floe", and heads south from Ellesmere Island. See the link below the image for an extended description.
[Long Description] Map showing West coast of Greenland, Ellesmere Island, Devon Island, and Baffin Island. Two routes are shown. One is labelled "Hall 1871" and "Route of Polaris". This route heads north along the coast of Greenland, and shows stops at Godhavn and Upernavik. It continues North through Kane Basin, and passes Joe Island. Just north of Joe island, the route ends, and there is a note: "Hall's death, Nov. 1871". The second route is labeled "200-day drift of party on the ice floe", and heads south from Ellesmere Island. At the start there is a note: "Party abandons ship, October 12, 1872". The route passes Devon and Baffin Island, and ends at the Northern tip of Labrador, where there is another note: "Rescued, April 30, 1873".
The next example is from the book More Abandoned Manitoba: Rivers, Rails and Ruins by Gordon Goldsborough. This map has a clear title and legend. Start with the title and describe the legend, then describe the key parts to the map to help convey its meaning to the reader.
[Alt-Text] Map showing vehicle ownership in Southern Manitoba. The title of the map reads: Number of Cars Registered in 1912. See the link below the image for an extended description.
[Long Description] Map depicting vehicle ownership in Southern Manitoba. The title of the map reads: Number of Cars Registered in 1912. There is a legend that shows red circles of increasing size with a white car icon in the center of the circle. Each circle represents a number of cars. The smallest circle is 1-5, then next size up is 6-10, then 11-25, then 26-100, then 101-1000 then 1001-2025.
The map shows Manitoba with all the major cities and towns labelled with a variety of different sized red circles, mainly over the southern part of the province. The main areas are highlighted as follows: Winnipeg, represented by the circle for 1001-2025 cars, and Brandon, represented by the circle for 101-1000 cars, have the largest circles. Dauphin, Virden, Neepawa, Carberry, Portage La Prairie are represented by the circle for 26-100 cars. Russell, Minnedosa, Gladstone, Souris, Deloraine, Boissevain, Crystal City, Morden, and Winkler are represented by the circle for 6-10 cars.
The next 2 examples are from DAISY's webinars on Long Descriptions and where written by Huw Alexander from textBOX.
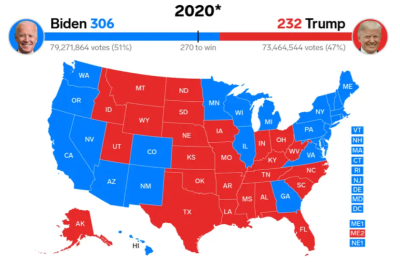
[Alt-Text] The map is color-coded to reflect the winning party in each state, with Blue representing the Democrats and Red representing the Republicans. See the link below the image for an extended description.
[Long Description]A horizontal bar chart, positioned above the map, illustrates the overall result with Democratic nominee, Joe Biden, receiving 306 votes, and incumbent Republican president, Donald Trump, receiving 232 votes. The results for each state are presented in the following table. The states, listed alphabetically, are presented in Column 1, the winning party is listed in Column 2, and the number of Electoral College votes for each state are presented in Column 3. Split Electoral College votes in Maine and Nebraska are represented by two rows for the respective votes. The data are as follows:
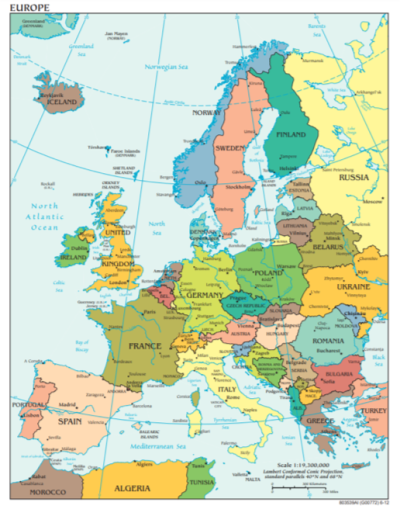
 [Alt-text] A political map of Europe in 2012. Click the link below to navigate to Long Description.
[Long Description] The map includes each of the countries of Europe in 2012. The 4 quadrants of the map cover the following countries.
- Northwest: Iceland, the United Kingdom, Ireland, the North Atlantic Ocean and the Norwegian Sea.
- Northeast: The Scandinavian countries of Norway, Sweden, and Finland and the Baltic nations of Lithuania, Latvia and Estonia.
- Southeast: The Eastern European nations including Poland, Czech Republic, Ukraine, Hungary, Romania, and Bulgaria. The Balkan countries including Croatia and Serbia. Greece and the Mediterranean Sea lies to the south.
- Southwest: The Western European nations including Denmark, Germany, Netherlands, Belgium, France, Switzerland, Italy, Spain and Portugal.
The capital city of each country is marked by a star. Other major cities are referenced. Major rivers such as the Danube are illustrated.
The edge boundaries of the map are Greenland, northwest, Russian, northeast, Turkey, southeast, and Morocco, Algeria and Tunisia, southwest. Each country is a shaded a different colour to help differentiation only. The scale ratio is 1 to 19.3 million. Scale measurement is 1 centimeter to 100 kilometers.


